 5:25 PM
 Unknown
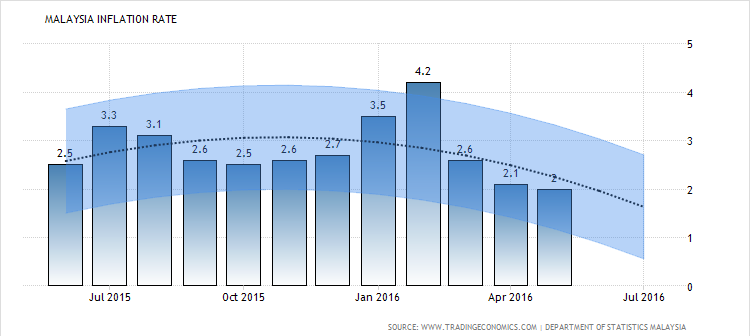
Consumer
prices in Malaysia rose 2.0 percent year-on-year in May of 2016,
compared to a 2.1 percent gain in April and matching market estimates.
It was the lowest inflation figure since April 2015 as prices of food
and housing & utilities eased while cost of transport fell further.
Year-on-year, prices moderated for: food & non-alcoholic beverages
(+4.1 percent in May from +4.2 percent in April); housing, water,
electricity, gas & other fuels (+2.2 percent from +2.6 percent);
furnishing, household equipment & routine maintenance (+2.2 percent
from +2.6 percent); health (+2.0 percent from +2.2 percent); recreation
services & culture (+1.5 percent from +1.6 percent), restaurants
& hotels (+2.5 percent from +2.7 percent) and miscellaneous goods
& services (+2.5 percent from +2.6 percent). Price rose at a faster
pace for: alcoholic beverages & tobacco (+22.1 percent from +20.1
percent) and education (+2.2 percent from +2.1 percent). In contrast,
cost declined for clothing & footwear (-0.9 percent from -0.7
percent), transport (-5.6 percent from -5.5 percent) and communication
(-2.2 percent from -2.1 percent).
| Calendar | GMT | Reference | Actual | Previous | Consensus | Forecast |
| 2016-04-20 | 4:00 AM | Mar | 2.60% | 4.20% | 3.60% | 3.70% |
| 2016-05-20 | 4:00 AM | Apr | 2.10% | 2.60% | 2.20% | 2.20% |
| 2016-06-15 | 4:00 AM | May | 2.00% | 2.10% | 2% | 2.20% |
| 2016-07-20 | 4:00 AM | Jun | 2% | 2.30% | ||
| 2016-08-24 | 4:00 AM | Jul | 2.60% | |||
| 2016-09-21 | 4:00 AM | Aug | 2.40% |
Among food & non-alcoholic beverages, customers had to pay more
for: food (+4.2 percent in May from +4.4 percent in April); food at home
(+4.6 percent from +4.6 percent); rice, bread & other cereals (+0.9
percent from +0.9 percent); meat (+0.3 percent from +0.5 percent); fish
& seafood (+6.6 percent from +8.4 percent); milk & eggs (+1.1
percent from +0.1 percent), oils & fats (+0.4 percent from +0.4
percent), fruits (+6.1 percent from +7.3 percent); vegetables (+15.3
percent from +12.5 percent); sugar, jam, honey, chocolate &
confectionary (+1.8 percent from +2.1 percent); food products (+5.3
percent from +4.9 percent) and food away from home (+3.6 percent from
+3.9 percent) and coffee, tea, cocoa & non-alcoholic beverages (+0.6
percent from +1.0 percent).
| Forecast | Actual | Q2/16 | Q3/16 | Q4/16 | Q1/17 | 2020 | Unit |
| Inflation Rate | 2 | 2.3 | 3.1 | 3.3 | 3.4 | 3.47 | percent |
Core consumer prices rose by 2.1 percent year-on-year in May, slowing from 2.3 percent in the preceding month.
On a monthly basis, consumer prices rose 0.3 percent, after gaining 0.4
percent in April. Upward prices pressure came from: food &
non-alcoholic beverages (+0.3 percent), alcoholic beverages &
tobacco (+0.1 percent), housing, water, electricity, gas & other
fuels (+0.5 percent), health (+0.1 percent), recreation services &
culture (+0.1 percent), restaurants & hotels (+0.2 percent) and
miscellaneous goods & services (+0.2 percent). In contrast, prices
declined by 0.1 percent for clothing & footwear. Prices remained
unchanged for: furnisshing, household equipment & routine
maintenance, transport, communication and education.
Source: http://www.tradingeconomics.com


